
Abstract
Notes for reading paper Machine Learning in Chinese Stock Market
Main results
(1) Neutral networks robustly outperform other methods in terms of out-of-sample R^2
(2) The out-of-sample R^2 are particularly large for the subsamples of small firms and non-state-owned firms. Hence, predictability is more significant for those subsamples of stocks in which retail traders plays a much bigger role.
(3) Comparing the out-of-sample R^2 with studies in the U.S. market, the Chinese market reveals substantially more predictability.
(4) out-of-sample predictability.
(5) unconditional and conditional predictive ability test.
(6) explores whether predictability translates into portfolio gains.
other results
We also find that predictability of SOEs (国有企业) in terms of out-of-sample predictive R^2 is weaker than for non-SOEs at a monthly prediction horizon, which confirms the SOE’s reputation of being non-transparent (国企的声誉并不透明).
Our results indicate that also that a long-only portfolio can provide substantial and, even after including transaction costs, economically signi cant performance (我们的结果还表明,一个只做多的投资组合可以提供实质性的、甚至包括交易成本在内的经济显著的业绩 )
Methods and Data
Methods
-
(1) Apply the empirical design of Gu et al. (2020b) to the Chinese market.
-
(2) linear models:
ordinary least squares regression (OLS)
partial least squares (PLS)
least absolute shrinkage and selection operator (LASSO)
elastic net (Enet)
gradient boosted regression trees (GBRT)
random forest (RF)
variable subsample aggregation (VASA)
neutral networks with only 5 layers (NN1 - NN5)
Data
-
(1) WIND
-
(2) CSMAR
-
(3) Predictors: Green et al. 2017. The characteristic that provide independent information about average US monthly stock return. A large collection of stock-level predictive characteristic based on the variable definitions in the original literature listed in Green et al. 2017, and the literature on China-specific factors.
Data process
- (1) classify predictors
90 * 1 vector of stock-level characteristics, 11 * 1 vector of macroeconomic predictors, 80 * 1 vector of dummy variables
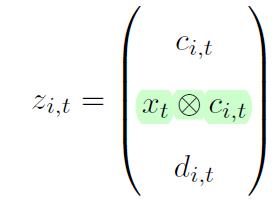
- (2) interaction term between two groups of predictors
Using Kronecker product (直乘) to represent the interaction terms between stock-level characteristics and the eleven macroeconomic predictors:
 We first explore the variable importance of 11 macroeconomic variables and
94 stock characteristics for all prediction models based on the Chinese stock market. The variable improtance is defined similarly as in Gu et al. (2020b).
Empirical analysis
-
We start exploring our models’ prediction performance via out-of-sample predictive \(R^2\) and discuss predictability across different subsamples of our data.
-
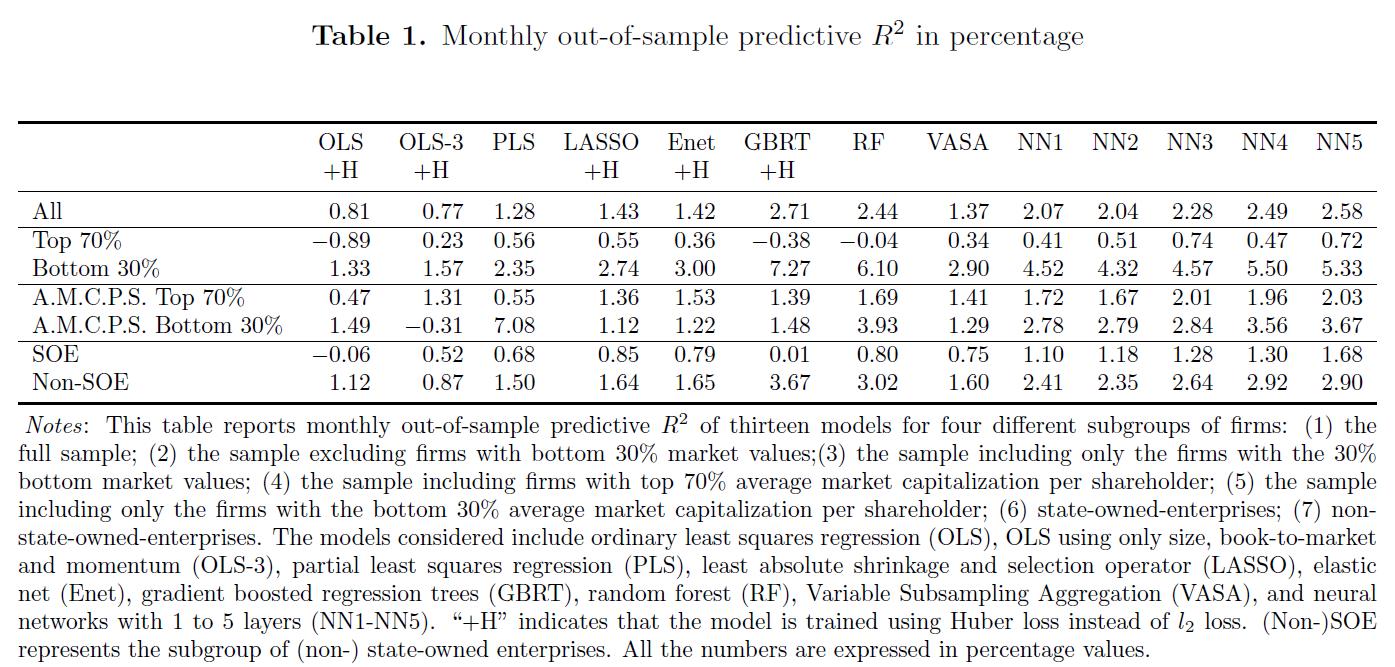
Table1:
- 将样本进行 SOEs 和 non-SOEs 分类的原因: As state-owned enterprises (SOEs) play an prominent in China’s capital markets and are often criticized for information transparency, we explore the R^2 for both SOEs and non-SOEs.
- 将样本进行 70% - 30% 分割的原因:As Liu et al. (2019) argue, the samllest 30% of firms often serve as potential shells in reverse mergers that circumvent tight IPO constraints. (正如Liu等人(2019年)所说,最小的30%的公司通常是潜在 的规避严格IPO约束的反向合并中的空壳 ) At the same time, Chinese retail investors have a notorious preference for investing in small stocks, in particular growth and glamour stocks.(与此同时,中国散户投资者对小型股的投资偏好很强,尤其是增长型和魅力型股票 )
- 将样本按 market capitalization per shareholder 分割的原因:To shed light on the connection between predictability and retail investors, we further conduct subgroup analysis based on the average market capitalization per shareholder. At last, we investigate model predictability by looking into the out-of-sample R^2 for thses two groups.
- OLS model: OLS model achieves a positive R^2 of 0.81%, showing even the simplest model still has some predictive power. The R^2 for OLS-3 is slightly lower than that for OLS (0.77% v.s. 0.81%), indicating the three covariates alone (size, book-to-market, and momentum) are insufficient to account for all predictive power in linear models. It is noteworthy that the OLS model performs much better in China's stock market than in the U.S. stock market
- For PLS, LASSO, and Enet, the improvement of the R^2 directly reflect the effectiveness of dimension reduction when we are faced with a large set of covariates . (对于 PLS, LASSO, Enet, R^2 的提升反映了面对大量协变量 时降维的有效性。)
- 因此,R2的这种提升表明,一些股票特征对于预测中国股市的月度回报是多余的, 这与顾等人(2020b) 对美国市场的研究结果很好地吻合.
- 树模型、GBRT和RF以及五个神经网络模型都对 R^2 有所改进, 在所有七种型号中甚至进一步达到2%以上。 这种改进证明了机器学习方法在捕捉预测因子之间复杂交互方面的优势,Gu等人(2020b) 也强调了这一点。
- The results in Table 1 suggest that all models have a much better predictive performance for small stocks. The linear models, the linear models, OLS and OLS-3, now raise their R^2 to above 1%, while the regularized linear model, including PLS, LASSO, and Enet, nearly double their performance.
- 负的 R^2: Interestingly, OLS, RF, and even GBRT, now have negative R^2, indicating they are easily dominated by a naive forecast of zero returns for all stocks in all periods.
- Table2:
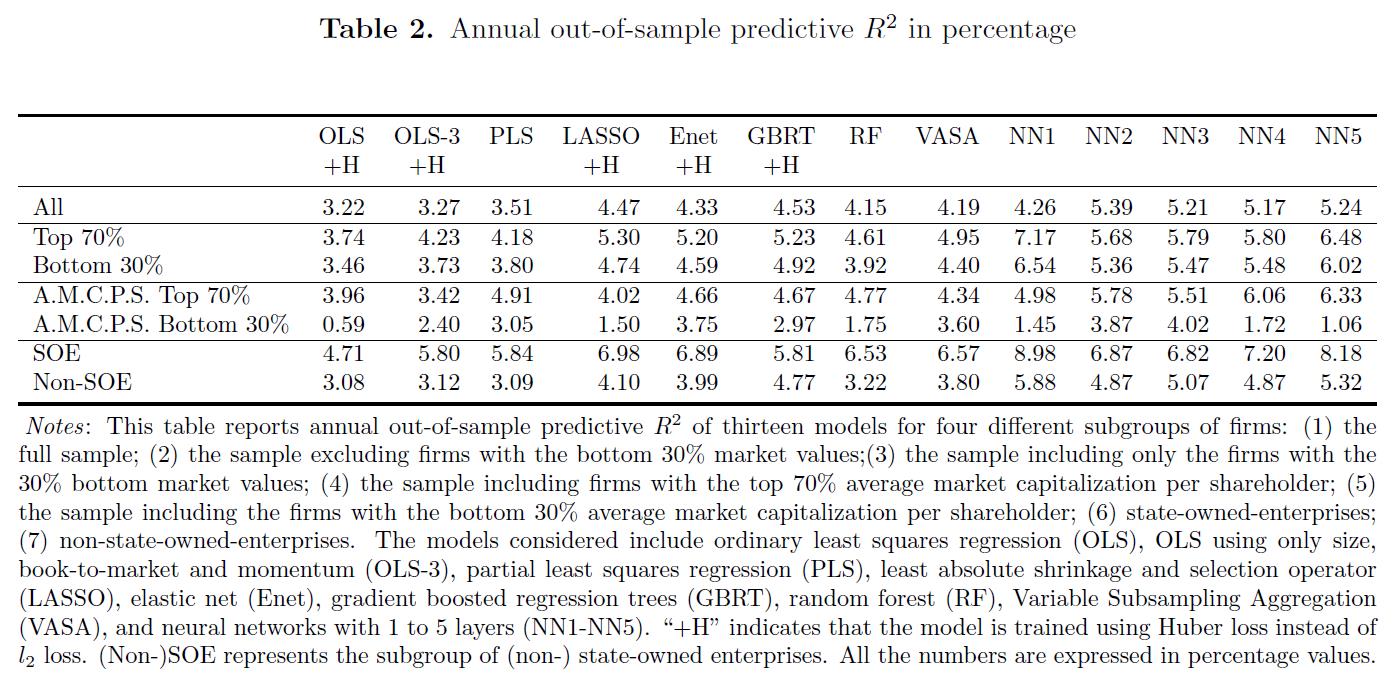
- 表明机器学习方法可以在更长的时间内成功地隔离持续风险溢价: We find that the annual
out-of-sample R^2 are higher than their monthly counterparts, indicating machine learning
methods can successfully isolate persistent risk premiums at longer horizons.
*我们将短期可预测性(尤其是小型股)归因于散户投资者在中国股市中的突出作用。 正如我们稍后将看到的,在较短的视野内,神经网络更加重视小盘股的波动性和动量相关变量, 这可能反映了散户投资者的短期投机行为,以及他们的知名度也就是喜欢优先交易小型股
- 表明机器学习方法可以在更长的时间内成功地隔离持续风险溢价: We find that the annual
out-of-sample R^2 are higher than their monthly counterparts, indicating machine learning
methods can successfully isolate persistent risk premiums at longer horizons.
- Table4:
Given the large number of predictors, we next investigate whether certain predictors are more important than others. To this end, we differentiate between the macroeconomic variables and the stock characteristics. (鉴于预测因素数量众多,我们接下来研究某些预测因素是否比其他预测因素更重要。 为此,我们区分了宏观经济变量和股票特征。)
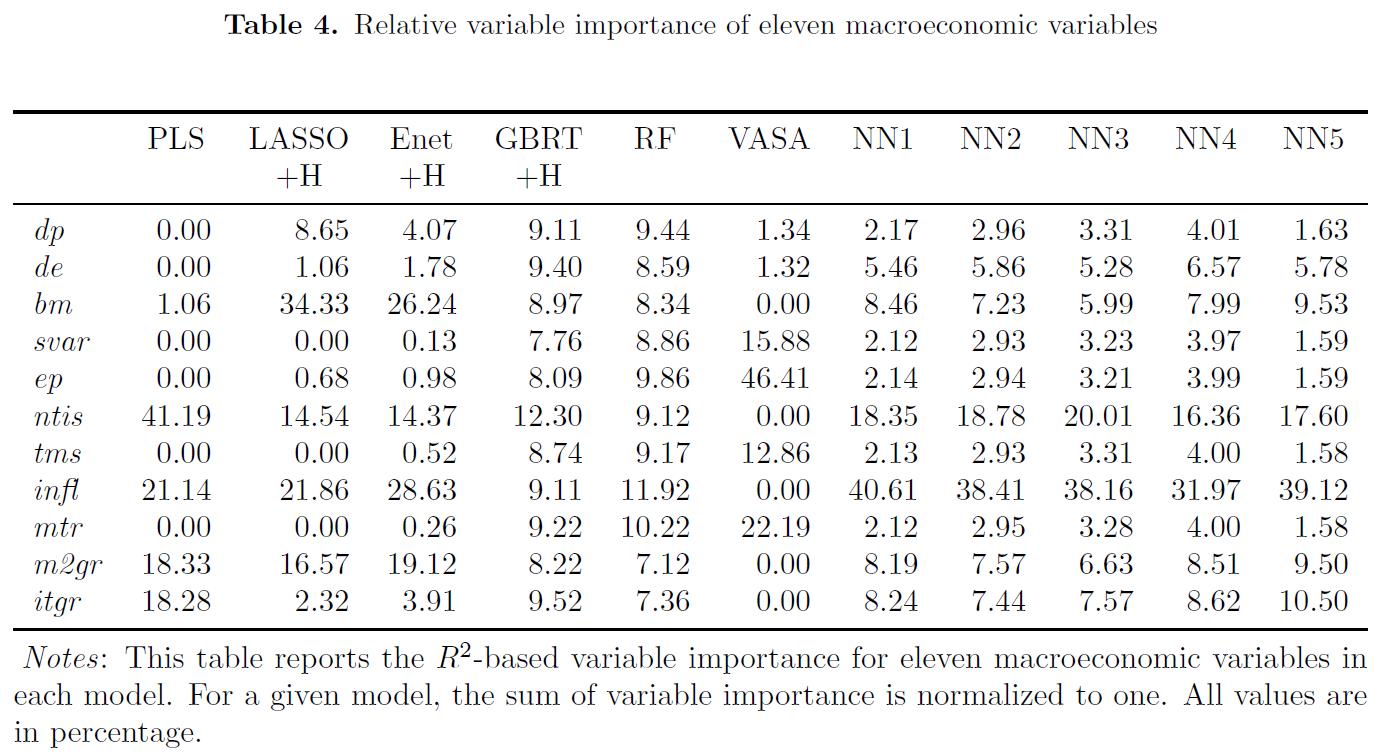
- Table 4 reports the relative variable importance of our 11 macroeconomic variables
- For PLS, ntis, which measure the level of issuance activity, has the largest variable importance. (对于 PLS, ntis 拥有最大的 variable importance)
- China has been adopting an approval-based IPO system ever since its stock market opened, and it is wellknown that the China Securities Regulatory Commission often suspends or reduces the volume of IPOs when the market is down, making it reasonable for ntis to play an important role in predicting monthly returns. (中国自股票市场开放以来一直采用基于批准的IPO制度, 众所周知,中国证监会经常在市场下跌时暂停或减少IPO数量,这使得NTI在预测月度回报方面发挥重要作用是合理的。 )
- 值得注意的是 ntis 是 GBRT 最重要的 macroeconomic variable 同时也是 neural networks 第二重要的 variable.
-
如何证明树模型能够检验出 predictors 之间复杂的非线性相互作用
(The distribution of macroeconomic variable importance for tree models GBRT and RF is relatively more uniform than other regression-based methods, indicating these two methods can detect potentially complicated nonlinear interactions between macroeconomic variables and stock characteristics) 与其他基于回归的方法相比,树模型GBRT和RF的宏观经济变量重要性 分布相对更加均匀,表明这两种方法可以检测宏观经济变量和股票特征之间潜在的复杂非线性相互作用.
- Figure 1:
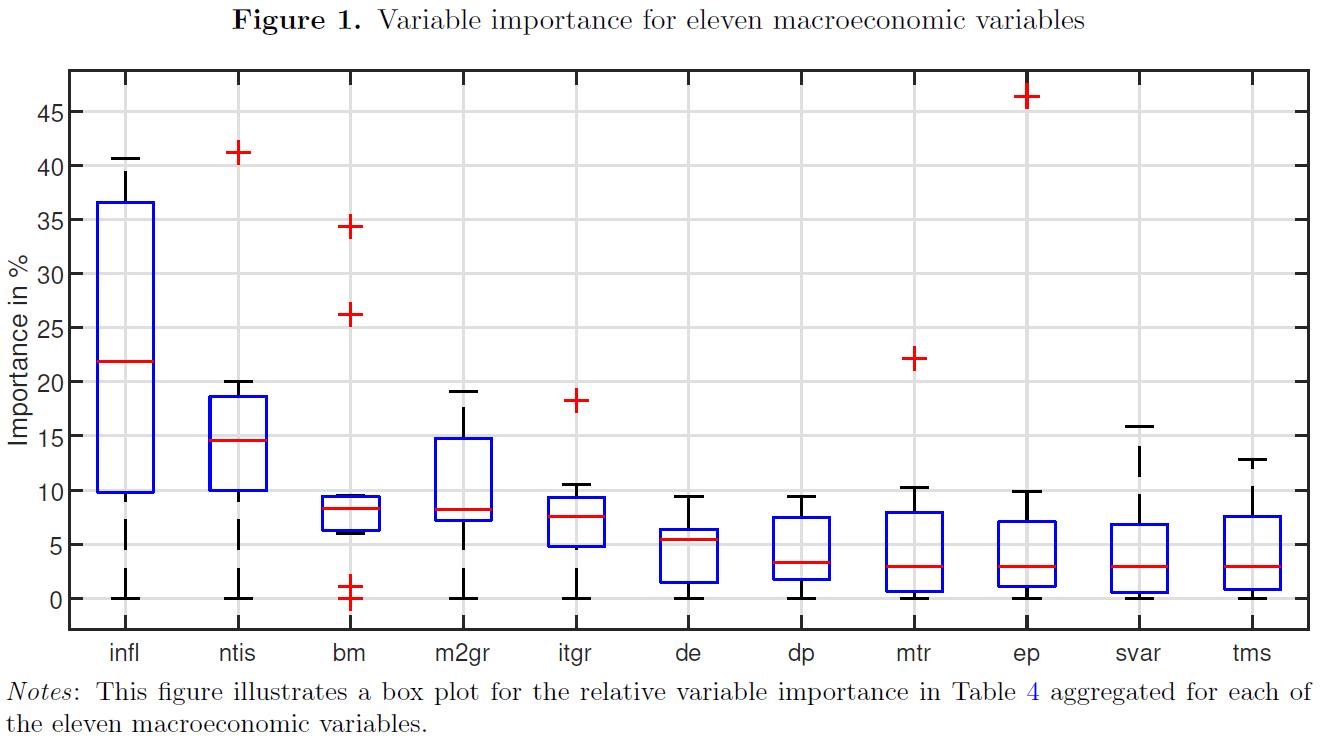
- 图1汇总了每个宏观经济变量的模型变量重要性。总体而言,我们发现infl和NTI是预测中国股市月收益率的两个最常用的宏观经济变量, 尤其是神经网络。另一方面,股息价格比(dp)、市场波动率(svar)、每股总收益(ep)、期限利差(tms)和市场流动性(mtr)不太重要, 因为大多数模型都忽略了它们。
- Figure 2:
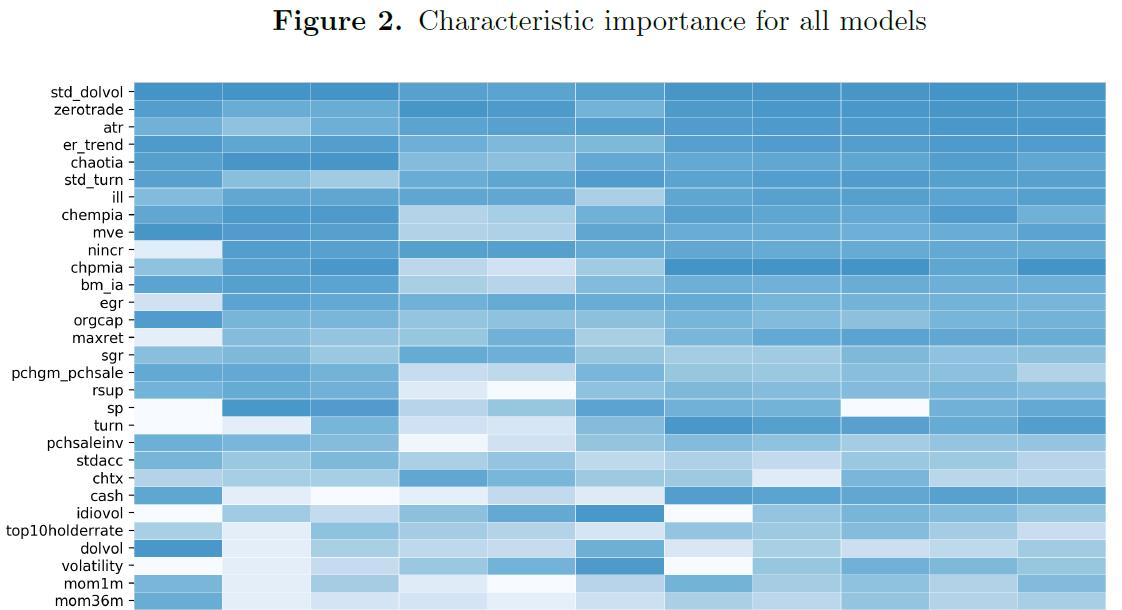
- 关于整体变量重要性的排序,发现,在预测中国股市时,与市场流动性相关的股票特征最为相关, 即流动性波动性(std-dolvol和std-turn)、零交易日(zerotrade)和非流动性测度(ill)是最显著的预测因子。
- 第二个有影响力的群体包含基本面信号和估值比率,如行业调整后的资产周转率变化(chaotia)、 行业调整后员工变化(chempia)、总市值(mve)、近期收入增长数、nincr、行业调整后利润率变化(chpmia) 和行业调整后账面市值变化(bm_ia)。
- 第三组由风险度量组成,包括特殊回报波动率(INDIVOL)、总回报波动率和市场贝塔(beta)。 我们的研究结果与 Gu等人(2020b) 在美国市场的研究结果进行了鲜明的对比和差异。 他们发现,传统的价格趋势指标是最具影响力的预测指标,对中国股市来说, 除了最近的最大回报(maxret)外,其他指标的重要性都较低。
- 有趣的是,异常周转率( abnormal turnover ratio)(atr) 也是机器学习模型中的一个影响因素( 在总体变量重要性方面排名第三),这是 Pan等人(2015) 最初引入的一个中国特殊因素, 用于捕捉普遍投机交易的影响。
- 第四有影响的 predictors 是 trend factor: atr 和 ex_trend , 刘等人(2020年) 引入的趋势因子(er_trend) 解释了中国股市价格和成交量的持续趋势。值得注意的是,作者最初引入了atr和er趋势, 以适应中国股市大量活跃个人投资者对经验资产定价的影响。
- 先前的研究,如 Pan等人(2015年) 和 Liu等人(2020年) 已经证明了在因子模型中包含中国特有因素的重要性,而在这里,我们提供了进一步的证据, 证明这些因素在更复杂的机器学习模型中也具有相当大的解释力。
- 从实践和理论的角度来看,我们也对 time variation of the variable importance 更为关注 值得注意的是,特别是对于LASSO而言,2015年前后的变量重要性似乎存在差距,这表明股市发生了结构性变化。 众所周知,中国股市在2015年经历了戏剧性的繁荣和突然崩盘,这可能解释了这一发现 ( Liu et al. 2016 ).
- 基于树的模型,包括GBRT和RF,倾向于选择比替代模型更广泛的特征集, 这也在 Gu等人(2020b) 中观察到。
- 同样,流动性变量和基本面信号是GBRT和RF最重要的两组预测因子,但它们的变量顺序与其他模型略有不同。
- 另一方面,树模型的变量重要性的时间变化相对较低。在这里, 我们还观察到2015年前后变量重要性的差距,特别是对于RF,如ill、idiovol和maxret。
- VASA在变量重要性方面的行为与PLS非常相似,因为VASA是用线性子模型构建的,但变量重要性的时间变化水平较高 。
- 神经网络模型(NN1-NN5)倾向于支持流动性变量、基本信号、 估值比率和中国特有的因素,包括异常周转率(atr)、趋势因子(er_trend)和前十大股东持股比例(top10holderrate)。
- 与其他模型相比,神经网络在变量重要性方面具有更大的时间变化, 这表明它们可以检测并解释不同预测因子预测能力中的结构突变。 我们将这一发现归因于神经网络模型的可行性和适应性,特别是当它们在大量数据的情况下经过调整和良好训练时。
- Table5:
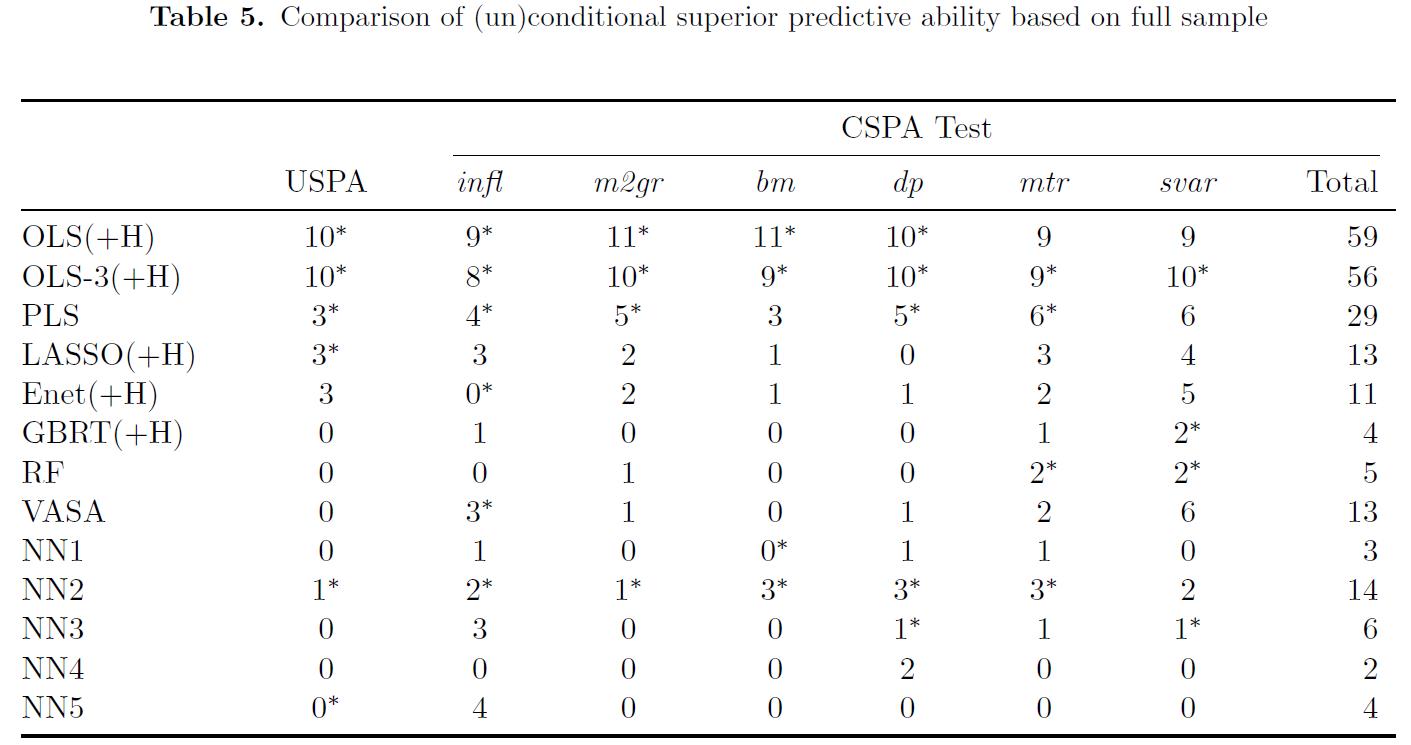
- 单纯的采用 out-of-sample R^2 作为 model selection 的基准在一些实际情况中表现的并不好。有一些模型 在 out-of-sample R^2 的结果上非常接近,但是 very different performance in reality. 这里我们可以采用 Conditional Superior Predictive Ability (CSPA) 来作为比较不同机器学习模型表现的指标。 这一方法是 Li, Liao and Quaedvlieg 发展的。
- The USPA test indicates that the naive OLS model and the modi ed OLS-3 model perform poorly, having the largest total number of rejections (USPA 测试表明,naive OLS模型和修改后的OLS-3模型表现不佳,rejection 总数最大)
- The GBRT, RF, NN3, NN4, and NN5 have uniformly better unconditional prediction performance than their alternatives, but the USPA test fails to differentiate their performance. (GBRT、RF、NN3、NN4和NN5的无条件预测性能均优于其替代方案,但USPA测试未能区分其performance)。
- 观察比对 CSAP 的测试结果,CSPA测试使我们能够更全面地区分VASA、NN2和正则化线性模型的预测性能,提供统计证据表明这些模型不如NN4和NN5。
- Figure3
Dissecting the predictability performance of NN4 (剖析NN4的可预测性性能 ).
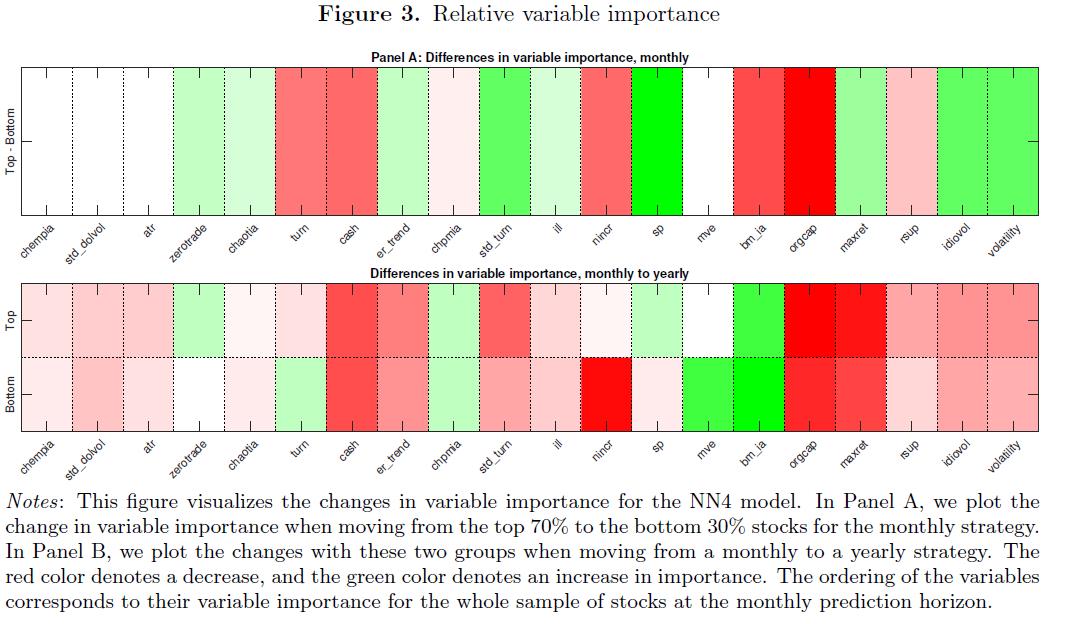
- Table1 - Table5 以及 Fig.1 - Fig.2 的结果表明,神经网络的predictability performance似乎优于其他模型 这些算法一个经常提到的缺点就是缺乏可解释性。然而,作为一种理智检查,并提供一些关于哪些变量导致了 considerable predictability, 对可预测性的驱动因素进行深入的挖掘。 为此,我们关注 NN4 模型 得到的 R^2_oos 值 在 samll stocks 和 large stocks 的 月度和年度的差异。
- Panel A, 纵轴表示: moving from the top 70% to the bottom 30% stocks for the monthly strategy 绿色表示:moving 之后重要性增加,红色表示 moving 之后重要性减弱。
- Panel A, 使用NN4 的到 20 个最重要变量的差异 (使用 NN4 预测每月范围内前70% 和后 30% 的股票)。
- Panel A, 当我们从大型股票转向小型股票时,三个最重要的predictor不会改变其重要性顺序: (1) chempia (2) std_dolvol (3) atr 。 当进入到 annual horizon, 这三个 predictors 的重要性会下降 (正如 Panel B 所示)。
- Panel A, for small stocks, while fundamental variables like cash, nincr, bm_ia, and orgcap obtain less weight. (zerotrade和std_turnorver等流动性相关predictor对small stocks 的权重更大, 而cash、nincr、bm_ia和orgcap等基本面相关变量的权重对small stocks 较小)
- Panel A, idiovoal 的结果支持了有限套利理论 (theory of limited arbitrage: anomalies become stronger for high idiosyncratic risk stocks and hence, leading to increased overall predictability)
- Panel A, maxret 的结果也证实了我们的猜测: influence of retail investors on the price dynamics of small stocks must be considerable. 如果投资者对与彩票式的回报有着强烈的偏好则极端正回报在股票的截面定价中 显示出显著的可预测性 (As Bali et al. (2011) show, if there is a strong preference among investors for assets with lottery-like payoffs, extreme positive returns exhibit significant predictability in the cross-sectional pricing of stocks ).
- er_trend : China-specific trend factor (er_trend) 是通过测量 volatility of noise trader demand 得到的,能够反映 market sentiment , 这一效应由散户投资者在中国市场的主导地位所强化。 (this effect is enforced by the dominance of retail investors in the Chinese market).
- NN4: 我们的NN4模型强调了这种中国特有趋势因子对小型股月度预测的重要性 (Our NN4 model underscores the importance of this China-specific trend factor for monthly predictions for small stocks),这些与趋 势相关的predictors 在月度水平的预测上与散户的影响力有关( are related to the influence of retail investors on monthly predictions) 相应的这些 predictors 的重要性 in Panel B 减少了,Panel B 是 annual horizon, 这也说明了 投机行为在 longer horizons 中被 wash out.
- Panel A 揭示了神经网络结合基本面变量 ( NN4 fundamental variables ) 对小型股的预测能力一般。( reveals the general tendency that under NN4 fundamental variables have less impact on the predictability of smaller stocks )
- sp: ( sales-to-price , 销售价格比), Barbee et al. (1996) 指出 sp 对小型股的影响力更大 ( more relevance for smaller stocks). Bin et al. (2017) 也证实了 sp 在中国市场的重要性,他们指出:Top-performing stocks having smaller firm size tend to have significantly higher sales-to-price ratios relative to all other stocks.
- Figure4
我们没有进一步关注特定特征的重要性,而是决定将不同的特征收集到具有代表性的类别中, 以避免分析潜在的异常值 (Instead of focusing further on the importance of specific characteristics, we decided to collect different characteristics into representative categories to avoid analyzing potential outliers)
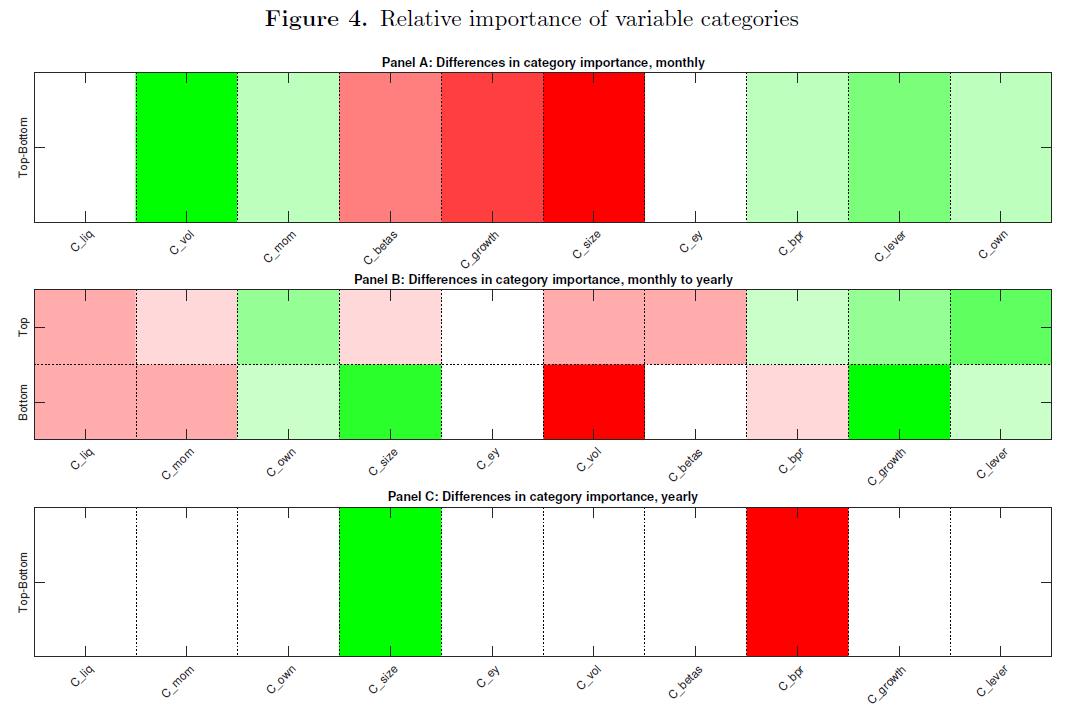
- 将因子分到10个类 (ten different categories): liquidity, momentum, ownership, size, volatility, earnings, beta, book-value ratios, growth, and leverage.
- Panel A : liquidity measures turn out to be the most crucial driver of monthly predictability.
- NN4 : 我们注意到,NN4(和其他神经网络)下的变量排名与所有预测模型的平均排名大不相同, 后者更注重基本因素。相比之下,神经网络似乎更喜欢动量和波动因素而不是基本面因素。 (We remark that the ranking of variables under NN4 (and other neural nets) is quite different to the average ranking across all prediction models, which puts more weight on the fundamental factors. In contrast, neural nets seem to favor momentum and volatility factors over fundamentals.)
- Panel B: Moving from a monthly to an annual forecast horizon, liquidity and momentum lose their importance in favor of ownership, growth, and leverage.
- 总的来说,神经网络NN4对不同 rm特征及其类别的重要性与我们的直觉很好地吻合。 此外,它有助于我们理顺小型和大型股票的可预测性之间的差异。 然而,与美国股市相比,中国股市的整体可预测性似乎仍然很大。 (Overall, the importance that the neural network NN4 gives to the different firm characteristics and their categories aligns well with our intuition. Moreover, it helps us to rationalize the differences between the predictability of small and large stocks. However, the overall predictability of the Chinese stock market appears still substantial compared to, e.g., the U.S. market.)
- 总的来说: 中国市场的整体可预测性可能来自卖空约束,这是中国市场的普遍特征。尤其地 当散户投资者占主导地位时,与其他市场相比,这些约束可能进一步加强可预测性和潜在的定价过高 (The overall predictability in the Chinese market might result from short-sale constraints, which are a universal feature of the Chinese market. Especially when retail investors dominate, these constraints might further enforce predictability and potential overpricing, compared to other markets)
- Table6
分析这种可预测性是否真的可以在考虑中国市场卖空约束和其他约束的投资组合策略中加以利用, 将是一件有趣的事情 (It will be interesting to analyze whether this predictability can indeed be exploited in portfolio strategies that account for shortselling constraints and other restrictions in the Chinese market)
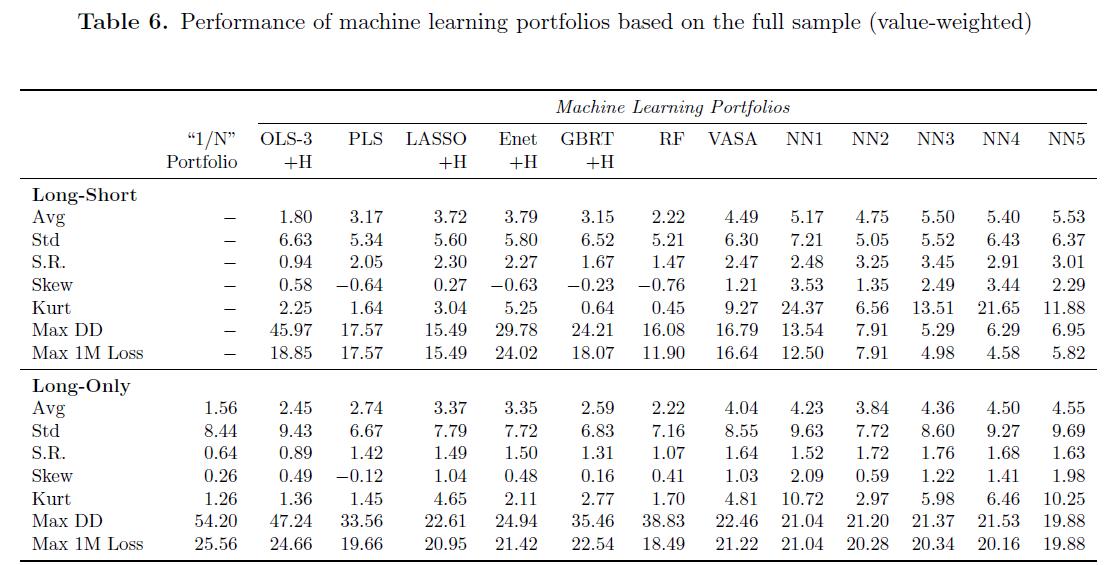
- long-short portfolio: construct long-short portfolio following the scheme in Gu et al.(2020b)
- long-only portfolio: include the long-only portfolio which only holds stocks in the top decile.
- Also report the performance of the 1/N-portfolio in which all stocks are equally-weighted.
- 整体来说:Table6 clearly demonstrate that machine learning techniques, especially neutral network models, are advantageous for portfolio-level forecasts.
- Figure5
Cumulative log return of machine learning portfolios (full sample)
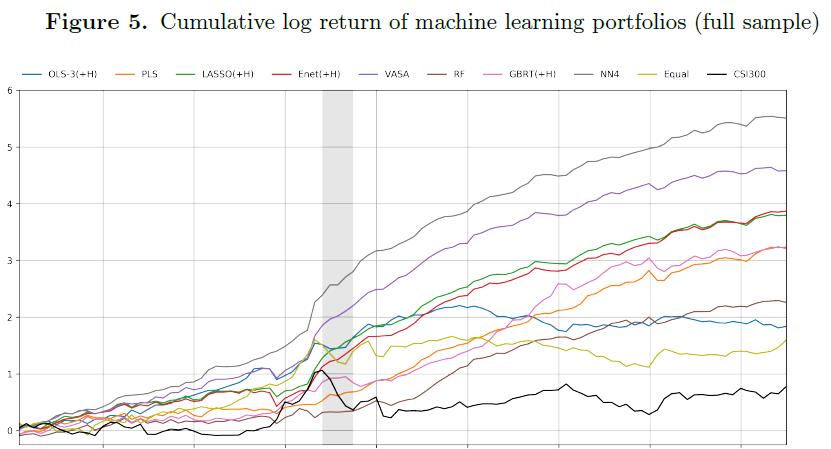
- 有趣的是,这两种方法的多空组合在2015年股市崩盘期间表现非常好,阴影区域显示了这一点。 (It is intriguing to note that the long-short portfolio for these two methods performs very well during the stock market crash in 2015, indicated by the shaded area.)
- COVID-19: The most recent global shock due to the COVID-19 pandemic in early 2020 does not lead to a notable downturn in portfolio levels.
- 所有机器学习投资组合的表现都优于1/N投资组合以及市场指数 (all the machine learning portfolios outperform the 1/N portfolio as well as the market index)
- Figure5 和 Table6 证实了 Gu et al. (2020b) 的发现: neutral networks outperform all other models considered in their study.
- ! Sharpe ratio : For the long-short portfolios, it is noteworthy that we obtain substantially higher Sharpe ratios in the Chinese stock market than those in the U.S. market found in Gu et al. (2020b).
- ! Sharpe ratio : the highest Sharpe ratio for the long-only portfolio is 1.76, still higher than the long-short strategy in the U.S. market.
- Table8
SOEs and non-SOEs 有趣的是,国有企业的可预测性如何体现在不同投资组合策略的绩效中。 (It is interesting to see how the SOEs’ predictability manifests in different portfolio strategies’ performance)。
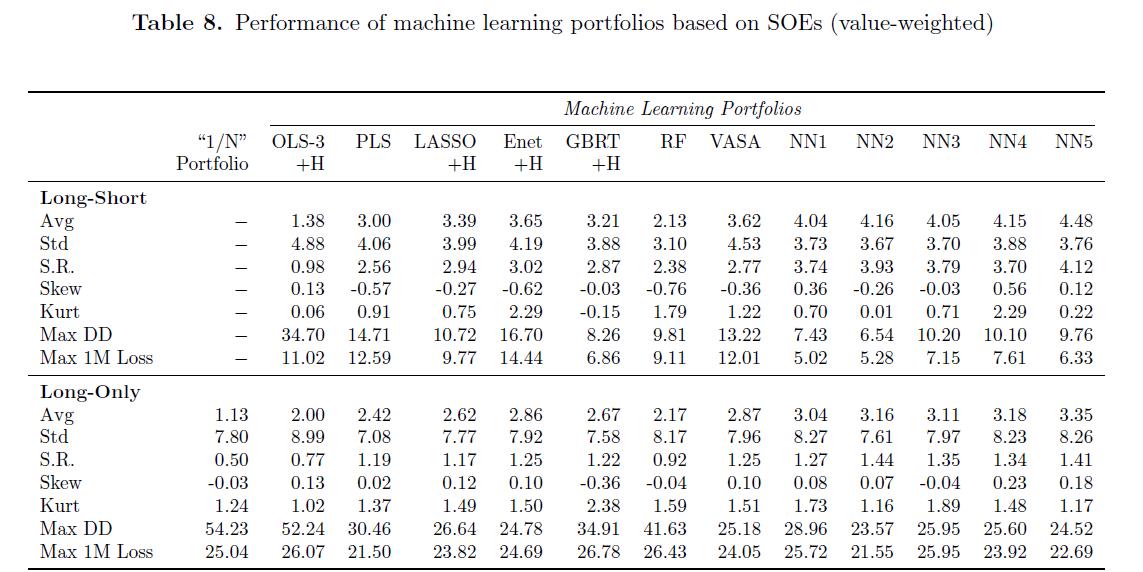
- 首先,我们注意到,在夏普比率方面,国有企业的多空策略表现远远高于前70%的股票,尤其是神经网络。
- 使用适当的预测算法,我们可以成功地缓解之前文献中关于国有企业会产生更大的碰撞风险的担忧。
- Table9
Transaction cost (交易成本) 为了评估投资组合绩效的经济意义,我们最终必须在分析中纳入交易成本。
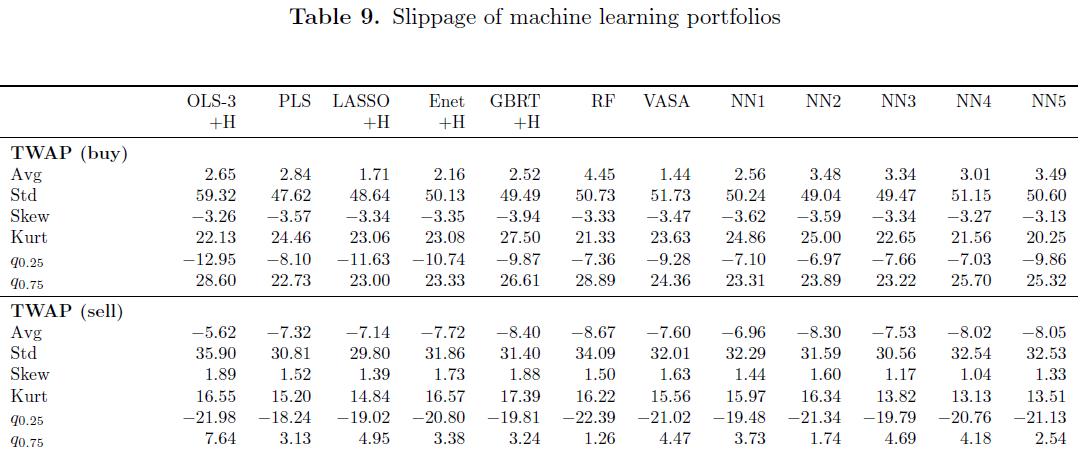
- 交易成本包括:commission (佣金), stamp tax (印花税), slippage (滑点).
- 这里我们采用两种交易策略来量化出滑点的大小 (Here, considering two trading shcemes to quantify the size of slippage
- 测量滑点方法一:time weighted average price (TWAP): 给定月份第一个交易日的前30分钟的time weighted 平均价格,因为我们假设订单平均分配,并在每分钟开始时执行,并且是月度交易。 slippage = TWAP - open_price.
- 测量滑点方法二:volume weighted average price (VWAP): 通过采用20天移动平均估算每分钟间隔的交易量, 并根据预测交易量按比例执行订单。此外,我们通过计算股票交易量的5%来初略估计 market capacities.
- 考虑买入和卖出后,TWAP 和 VWAP 与开盘价的总偏差约为 10 个基点。因此 25 个基点 (10+10+5) 可能是 正常时期中国股市成本的合理估计。
- 采用保守的方法,考虑 20,40,60 和 80 个基点的交易成本,以考虑交易成本对投资组合绩效的影响。
- 交易成本分析表明,即使在交易成本规模的保守假设下,不同策略的绩效仍然具有经济意义。
- Table11
Daily price limits 每日限价规则在世界各地的证券交易所广泛使用,特别是在新兴市场,希望它们能作为一种市场稳定机制 Deb et al. 2010.
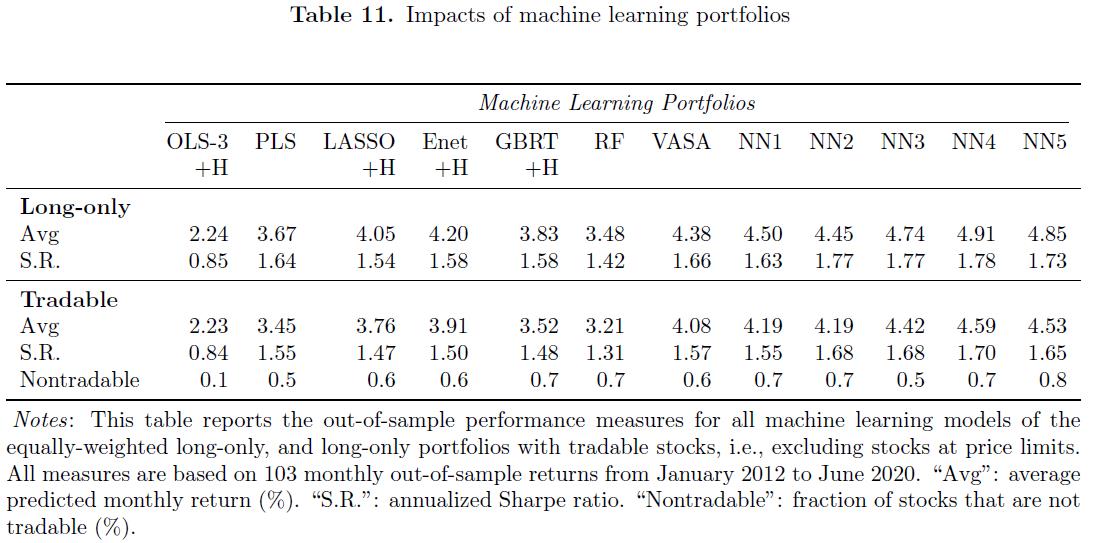
- 考虑到我们的预测范围是一个月的远期收益率而不是日收益率,我们推测我们的主要结果将仅受到限价规则的轻微影响。
- 为了探索限价对投资组合绩效的影响,我们进行了以下工作。 在每个再平衡日,我们排除了在买入目标价格上限收盘的股票, 并将卖出目标推迟到价格不在价格下限的日期。
结论:
-
1 中国股市有一些显著 (remarkable) 的特征,例如国有企业的存在和散户投资者的主导地位, 他们强烈偏好集体主义投资行为 (collectivistic investment behavior)。
-
2 在这种投机市场中,我们预技术指标比基本面更重要。我们发现,最关键的因素是基于流动性的交易信号。
-
3 令我们惊讶的是,基于价格动量的信号只起到了很小的作用。
-
4 股票市场需要很多年才能发展出允许和鼓励基本面投资的品质(It takes many years for stock market to develop the qualities that allow and encourage fundamental investing )。中国股市正朝着这个方向 发展,但我们的研究结果表明,今天,基本面因素已经是第二大关键因素。
-
5 还发现,散户投资者的短期主义 (short-termism) 在短期投资范围内产生了很大的可预测性,特别是对小型股。
-
6 由于政府信号在中国市场中发挥着如此重要的作用,观察到国有企业在更长的时间(longer horizons) 内的可预测性大幅提高。
-
7 不同的子样本在不同的时间范围内显示出不同的预测模式,这可能促使我们进一步探索散户投资者的角色。
-
8 投资组合分析表明,短期内的高可预测性转化为 long-short 投资组合的高夏普率
-
9 特别是神经网络和VASA在2015年中国股市崩盘期间也表现强劲。
-
10 在中国市场做空股票是不现实的。因此,我们还分析了只做多的投资组合,发现其表现仍然具有经济意义
-
11 总的来说,我们已经证明,机器学习方法可以(甚至更)成功地应用于与美国市场具有完全不同特征的其他市场。
-
12 在确定了几个令人兴奋的研究途径之后,我们希望向研究界提供我们的数据可以简化这些努力, 并进一步促进我们对金融市场,特别是中国市场的理解